

How heatmaps help conversion rate optimisation
Brief explanation of conversion rate optimisation (CRO)
Conversion rate optimisation is the art of optimising a website asset such as a landing page, website page, sales funnel or even apps, with the aim of converting more users into taking the action you wish them to take. So for example you might have an ecommerce website and you want people to buy more products. You would therefore run a CRO campaign that looks at text copy on the page, page structure, colours, calls to action, social proof amongst a few things that would influence and encourage visitors to buy at a higher rate than previously.
Introduction to heat maps as a tool for CRO
There are lots of tools that help with CRO, including A/B testing software, analytics suites but also the heatmap. A heatmap is a tool used frequently by marketing agencies and it overlays user engagement on a page providing heat signatures where people have clicked, hovered with their mouse, spent time reading.
The idea of this is to give an indication of areas of friction, or areas of interest from which you can draw conclusion to test against.

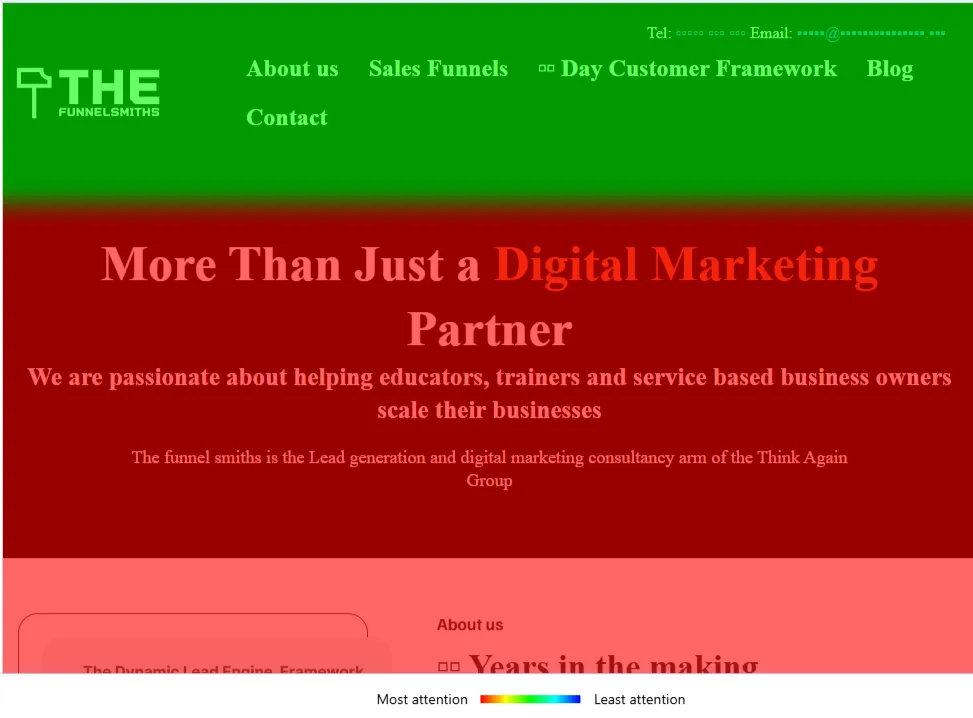
In the image above the coloured dots show where people have clicked our website, indicating areas of interest. Below shows an attention heatmap, which demonstrates where people spend there time most frequently.

What are the benefits of using a heat map?
Heatmaps give you actual user feedback, so your not guessing what users find interesting and areas a user may be struggling with. You do obviously need visitors to your website and the more data collected the better, but it offers clear indications, using real data.
Heatmaps are low yield in terms of page load and do not hugely affect the performance of your webpage, so makes it an idea solution for collecting user engagement data.
Most platforms that offer heatmaps, also offer more advanced screen recording features such as Clarity, which is a free tool provided by Microsoft.
Heatmaps can also be used in conjunction with other tools, such as A/b testing software, and analytical suites, and are used as part of a data collection exercise for full conversion rate optimisation techniques and methods.
How to Implement heat maps on your website for CRO?
My recommendation if your starting out is to use Microsoft's Clarity. Hers how to install it on your website:
Step 1: Sign Up for Microsoft Clarity
Before anything else, you’ll need a Microsoft Clarity account.
Visit Clarity’s website.
Click Get Started and sign in using your Microsoft, Google, or Facebook account.
Once logged in, create a new project by entering your website’s name and URL.
Step 2: Get Your Tracking Code
After creating your project, Clarity will provide a unique tracking code to integrate with your website.
Go to your Clarity Dashboard.
Click Set Up Clarity and copy the JavaScript tracking code snippet.
Step 3: Add Clarity to Your Website
The installation method depends on how your website is built:
For WordPress Users:
Install and activate the Microsoft Clarity Plugin from the WordPress plugin directory.
Navigate to Settings > Clarity and paste your Clarity project ID.
Save the changes, and Clarity will start tracking your site.
For Websites Using Google Tag Manager (GTM):
Open Google Tag Manager and go to your container.
Click Add a New Tag and choose Custom HTML.
Paste the Clarity tracking code and set the trigger to All Pages.
Save the tag and publish the changes.
For Manually Adding to Your Website:
Copy the Clarity tracking code from your dashboard.
Open your website’s HTML file or CMS settings where custom scripts can be added.
Paste the tracking code just before the
</head>tag.Save the changes and publish your website.
Step 4: Verify Installation
After adding the code, it’s important to confirm that Clarity is tracking correctly.
Return to the Clarity dashboard.
Click on Settings > Setup.
You should see a confirmation that tracking is active. If not, wait a few hours and check again.
Step 5: Start Analysing Visitor Behaviour
Once Clarity is tracking data, you can start exploring:
Heatmaps to see where users are clicking and scrolling.
Session Recordings to watch real user interactions.
Insights to identify engagement levels, dead clicks, and potential usability issues.
Once you start receiving data, you will be able to see how people visiting your website are viewing and engaging with your content. I usually advise a minimum of 1000 visitors to draw any real conclusion as you need to identify patterns to optimise against, otherwise you can see false positives in the data.
Once you have some clear indications, you need to then forumate what you want to test and how, this forms the basis for you CRO campaign to help with conversion.
Heat Maps are very useful for reviewing how people engage with your content and should be a key part of your analytics software, so you can go on creating and optimising your content, optimising your webpages to convert more visitors into customers and provide an all round better experience for people visiting your website.
If you have any questions on heatmaps, conversion rate optimisation or lead generation in general feel free to email us at [email protected] and we would be happy to help.
